Ever wondered what lies beneath your feet? Not the subway or sewer system—but deeper. What kinds of rocks, sands, and ancient layers are sitting silently beneath your home or city? If you’ve ever been curious, you’re in luck.
The US Geological Survey (USGS) has just revealed an interactive map that lets anyone look into the underground geology of the entire United States, and it’s available right now.
Table of Contents
Discovery

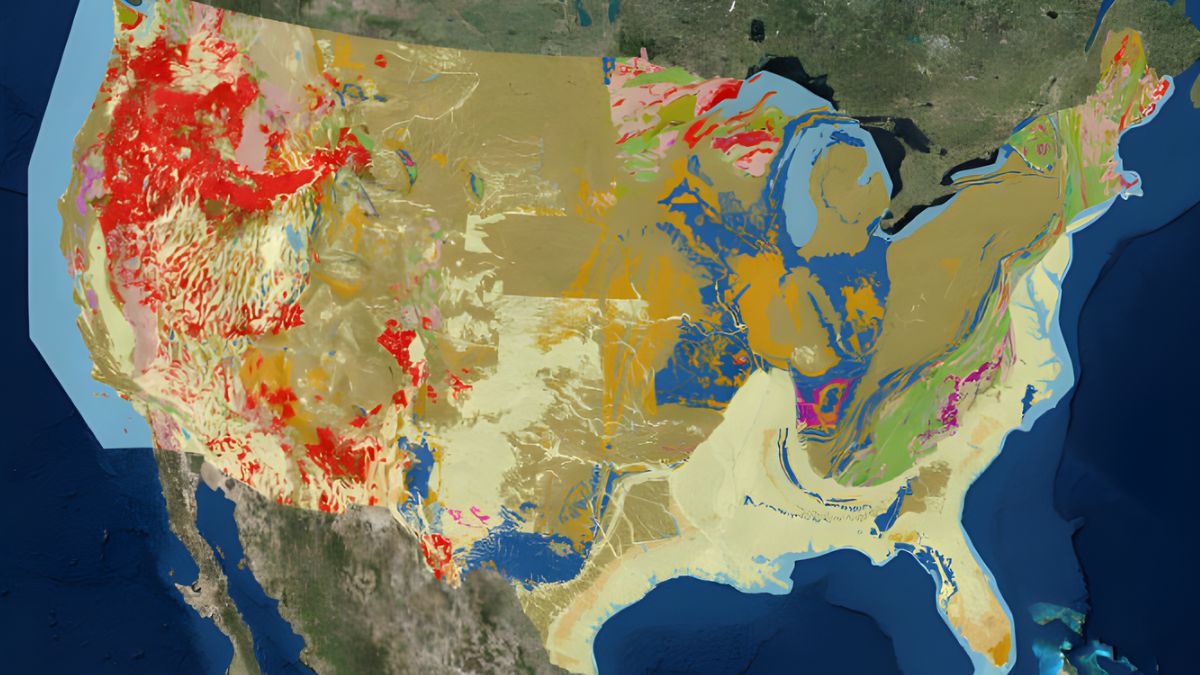
The newly released map is a national effort to pull together more than 100 individual regional geological maps into one easy-to-use platform. It offers a colorful, layered view of the Earth’s crust beneath the 48 continental U.S. states. Whether you’re standing on ancient granite or fresh river sediment, the map lets you find out exactly what’s under your shoes.
This isn’t just a pretty scientific tool—it’s an open window into Earth’s deep history.
Vision
At the heart of this massive project is USGS geologist Joseph Colgan. He envisioned a tool that not only helped researchers but also gave everyday people insight into the very land they live on. By unifying decades of geological surveys into a digital format, the USGS has created a platform that shows how mountains rose, rivers shifted, and ancient seas dried up—layer by layer.

Through this map, users can view sedimentary layers, locate fault lines, or even identify potentially unstable ground.
Layers
So, what exactly does the map show? Think of it like a cake made of time. Each layer represents a different geological period—some going back billions of years to the Precambrian era. The map uses colors to distinguish between rock types and their ages. From recent beach sand to deeply buried bedrock, it’s all mapped out.
Here’s a simplified breakdown:
| Color | Type of Material | Age Range |
|---|---|---|
| Yellow | River deposits & recent sediments | Thousands of years |
| Green | Sedimentary rocks | Millions of years |
| Pink | Granite & metamorphic rocks | Billions of years |
| Blue | Ancient ocean layers | Hundreds of millions |

This isn’t just academic—it’s practical. Understanding the types of ground beneath a location helps assess risks like earthquakes, landslides, and even flooding.
Purpose
The USGS interactive map isn’t just for scientists. It’s useful for city planners, engineers, builders, teachers, and anyone who needs to make smart decisions about land use. Whether it’s about choosing where to build a school or identifying earthquake-prone zones, the data is invaluable.
As Christopher Swezey from the USGS Mapping Program explains, these maps are crucial in locating resources like oil, gas, groundwater, and minerals. They also help prevent costly mistakes in construction by revealing areas with unstable or fragile geology.
Upgrade
Historically, updating geological maps was painfully slow. It took years to revise paper maps and cross-check findings. But with this new digital approach, that headache is gone.
USGS geologist Sam Johnstone pointed out that this new method allows for real-time updates. Old maps are digitized, reinterpreted, and added into a live database. So instead of waiting a decade, new discoveries can be reflected almost instantly.
Students, researchers, and just curious minds can now click a point on the map and see its geological story unfold—age, rock type, and formation origin all in one go.
Impact
This isn’t just a cool feature; it has a measurable return. Studies show that for every dollar spent on geological mapping, there’s a $7 to $10 economic benefit. That’s because it reduces construction errors, optimizes mining, and helps manage water resources better.
It’s also a powerful tool for education. Schools can use it to teach geology interactively. Governments can mark risk zones with precision, and even emergency responders can plan better for natural disasters like landslides and quakes.
Access
Want to check it out yourself? The map is totally free and available on the USGS website. Users can zoom in on any location, look into different layers, and even download the data for use in GIS systems or class projects.
Currently, the map covers the lower 48 states, but work is underway to add Alaska, Hawaii, and U.S. territories soon.
This is more than a map—it’s a time machine, a risk guide, and a digital excavation site all rolled into one. Whether you’re a student, a city planner, or just someone who digs rocks, this new USGS tool is your key to knowing the world beneath your feet.
FAQs
Is the USGS geology map free to use?
Yes, the map is completely free on the USGS website.
Can I access the map on mobile devices?
Yes, the map works on all modern devices and browsers.
Does the map include Hawaii and Alaska?
Not yet, but they will be added in future updates.
What can I learn from the map?
You can explore rock types, ages, and geological history.
Who benefits from this map tool?
Scientists, builders, planners, teachers, and the public.